The charts
Made one of your own? Put it anywhere on the web and leave its link for weft. It joins this shelf as one line on the beach, and nothing here needs rebuilding.
What makes a chart reflexive
Five moves, and the last four are the beach’s.
You put yourself on the line.
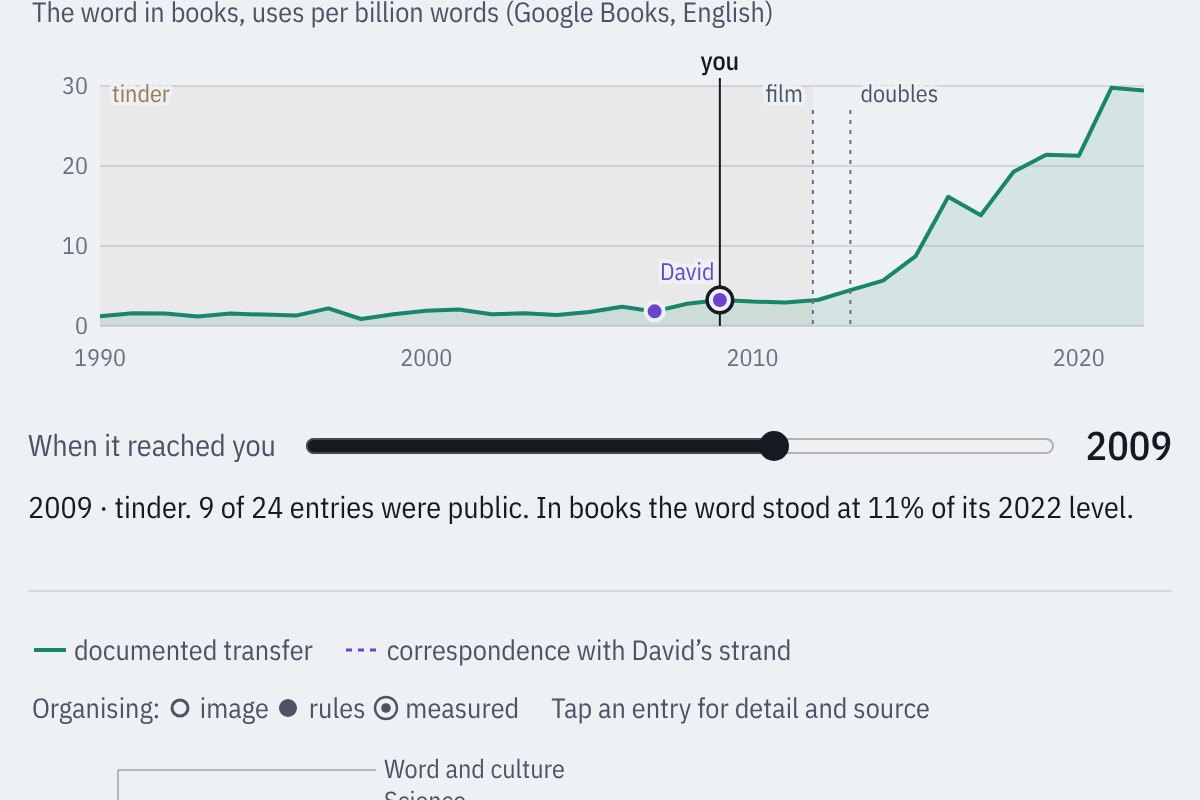
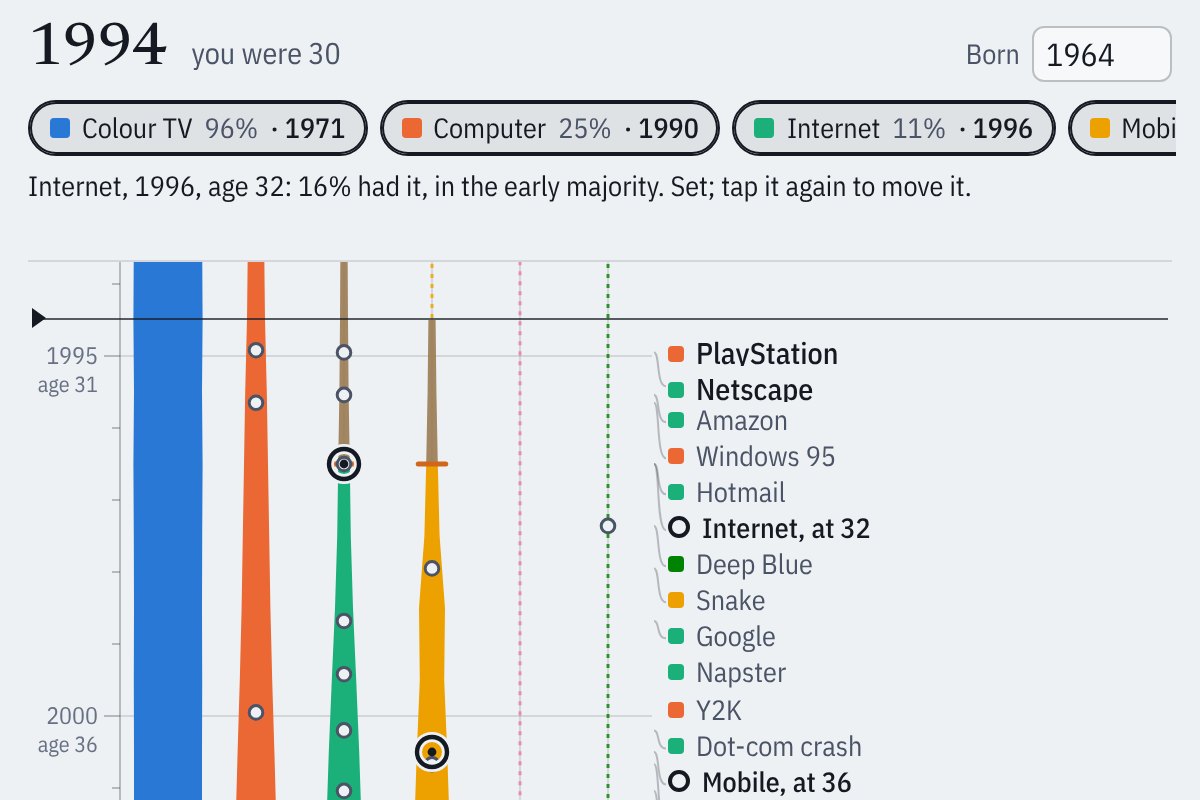
A slider for the year an idea reached you, a chip for the year each technology came into your home. With your own dot on the line, each entry stops being something to learn and starts working as a cue: a word like Walkman, Facebook or ChatGPT brings back where you were, who you were with and what it felt like, while you are still looking.
Your place is kept, in your own name.
Put it on the beach and it stands in your own mirror: a small record of yours, at the chart’s own addresses, that only you can change and you can take down at any time. It is made the first time you write, under the key you already use on the beach or one you invent there and then. There is nothing to join.
You see the others beside you.
Everyone who has put their place there stands on the same chart: who came in the tinder, before the flame; who arrived with the spark; who rode the tail; who joined each wave where you did. History stops being what happened to other people and becomes a crowd you were part of, with names in it, each a link to that person’s own page.
Each paragraph can be answered.
The short section that closes both charts is one text on the beach, and under every paragraph stands a mirror: what that paragraph brought back for you, or where it missed. A reading is filed by the page it was read on, so one paragraph gathers what it meant beside the starlings and what it meant beside the technology wave.
Any AI can read the room.
Every place and every reading is an open line on the beach, so anyone’s Claude with the beach’s tools can lay them side by side and say who stands out, who came early and who is most like you. Nothing is gathered anywhere else: the beach is the record, each reader keeps their own part of it, and the chart only draws what they keep.
Why read this way
Film of yourself surfing.
David Pinto, who makes these charts, compares it to getting film of yourself surfing:
You see where you were in the wave while you remember how the ride felt.
He calls it reflexive reading. The screen was a window onto other people’s history. With your dot on it, it becomes a mirror in which you can find yourself, and with other people’s dots beside yours, a picture of who was there with you.
Histories record the moment a technology or an idea broke through, and the few people named at that moment. Every wave also carried people who took it up before it broke: using it early, talking about it, passing it on. The charts mark those years as tinder. It is about when a thing reached you, not who made it: if your dot lands there, you didn’t invent it, but you were part of the conditions before the flame, and almost no history remembers that. Anyone who did help make one can say so in their own words beside the year. This is what the beach is for: making the preconditions visible before anything happens, and the people already gathered when the spark arrives.
It works best beside someone of another generation. Older readers have more of each wave stored; compare where your dots fall, and tell each other what each one brings back. What one person remembers changes what the other sees. The whole section, paragraph by paragraph with what readers have left under it, closes each chart.
How one is made
A page, and a family on the beach.
Behind every reflexive chart stands a family of blocks on the beach, all at the same addresses: the spine says what a reader places, each reader’s mirror holds where they placed it, and the fold is what anyone makes of all the mirrors read together at one address. The page reads every mirror it finds and draws them beside yours. Your place in the wave, as it stands:
spine:place-in-the-wave          what a reader places, one address each
  1.1  colour TV     2    a computer
  3    the internet
  4    a mobile      4.1  a smartphone
  5    social media  6    AI
  8    the year you were born, or its decade

place-in-the-wave:<handle>       each reader’s mirror, locked to their own key
  1.1  1971 — at my gran’s, with a games console
  3    1996 — dial-up, the family computer
  8    1960s

spine:reflexive-reading          the closing section the two charts share
  1 … 1.11111   six paragraphs, each standing on the one before
  under each:  2 read beside the starlings · 3 beside the technology wave
  2, 3          each chart’s own closing paragraphs
Readers write through the beach button when it is on the page. It holds their handle and key in a frame from the beach’s own address, so the page never sees the key, and the page asks it for three things: say, a reading at one address; keep, a whole mirror at once, saying what a replacement would take away; and ask, a question put in the reader’s own prompt, for them to send to their Claude or not. Without the button, the reader gives a handle, and the browser asks for their key once and keeps it on that device, as the site’s own pages do.
To make one:
- Frame a spine for what a reader places: one address for each thing, a few words saying what goes there.
- Build the page to read every mirror of the family it finds and draw them beside the reader’s own, each name a link to that person’s page.
- Give it a closing section a reader can answer: a lens of its own under
spine:reflexive-reading(the next digit is 4), or a section of its own. - Put it on this shelf: the reflexive charts stand at 5 in the animations block, with the chart’s family at its 4.
The families as they stand now: